Location, segregation, and accountability: the quest for better school ratings
Parents, homebuyers, and ed reformers all love simple, clear school ratings. Can we have them without reinforcing neighborhood segregation?
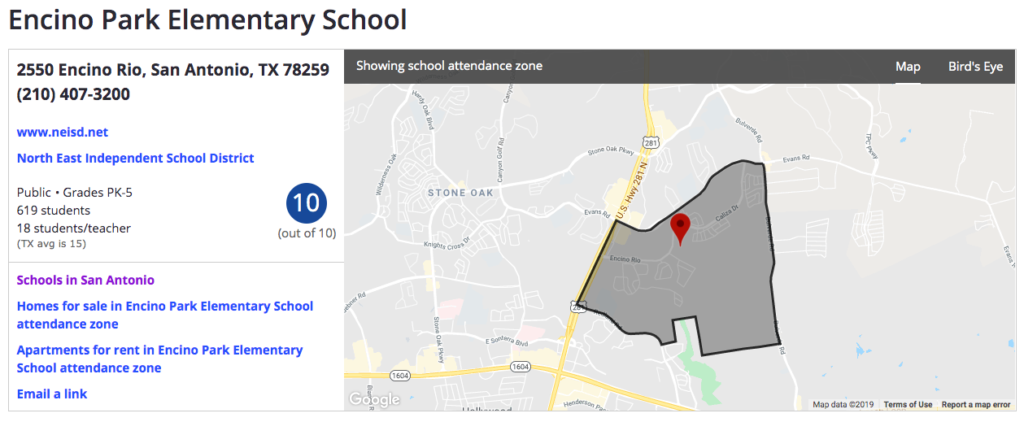
In the old real estate adage “location, location, location,” at least one of those locations represents proximity to a good school. It seems natural that parents would want this, and real estate investment experts confirm their hunch. A 2018 Forbes article recommends first-time homebuyers consider four priorities, and the first is location. Describing a good location, the author writes, “Look into things like crime rates and the quality of the school district.”
At some point in their hunt most homebuyers will visit at least one of the most popular search sites — Zillow, Realtor.com and Trulia — and encounter a seemingly simple measure of school quality: a color-coded GreatSchools.org ranking on a scale of 1 to 10, and a “parent rating” of 1 to 5 stars. States have followed suit with their own user-friendly report cards under the Every Student Succeeds Act (ESSA), but none have the market presence of Great Schools.
“We literally chose the house that we did based on proximity to and ratings of the schools,” said Clint Ochoa, a recent homebuyer in Texas. The ratings were clear and helpful for Ochoa and his wife while he was stationed in South Korea and she was in Atlanta with their three children. The whole home search had to happen online, and they knew very little about the area. Though they would go on to make school visits and talk to a real estate agent to discuss some of their family’s unique needs, Ochoa said, “Zillow was a starting place.” He’s in good company. In 2018, Zillow reported 157.2 million unique users per month, if those users clicked on a property, they saw a Great Schools rating.
Given the power to steer homebuyers and shape neighborhoods, it’s not surprising that the ratings used by these sites are under constant scrutiny.
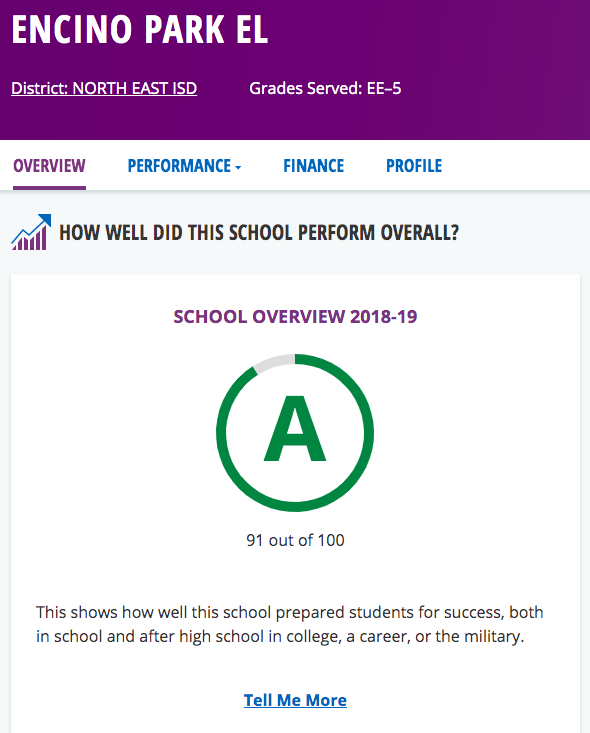
Critics—both parents and academics— have taken aim at what goes into the 1-10 rating. The formula has grown far more sophisticated since 2003 when Great Schools launched nationwide, but it still relies in part on test scores (state assessments, ACT, and SAT), which favor schools with wealthier students.
Even assuming that the summary ratings could somehow fairly and accurately measure school quality, University of Massachusetts-Lowell Assistant Professor and director of research for the Massachusetts Consortium for Innovative Education Assessment Jack Schneider still voices concern about their effect, whether from private or state agencies. Though state ratings are intended to spur school improvement, he said, “I think we should have some very serious questions about the theory of change that putting such information out there for the public is somehow going to guarantee better education experiences for young people.”
Great Schools is not in the accountability business, but instead aims to help parents make informed choices. This function is equally problematic for Schneider. Having a facile quantifier for how “good” and “bad” schools are, he says, drives neighborhood and school segregation, two of the culprits behind the achievement gap in the first place.
In search of a better measure
The accountability and rating craze began in the No Child Left Behind era and has done little more than reinforce what many already believed, Brookings Institute fellow Jon Valant said: schools serving low-income populations or large populations of black and brown students were bad and should be penalized and avoided.
“That was preventable,” Valant said. Once it was clear that the data showed little more than centuries of social and economic disparity—something schools can do very little about— state and federal governments could have tried to find a different way to measure what schools were actually doing, and get that information to parents.
“If you are going to show a label for the school,” Valant said, “it should be about what they are learning in the school … not how much they knew when they got there.”
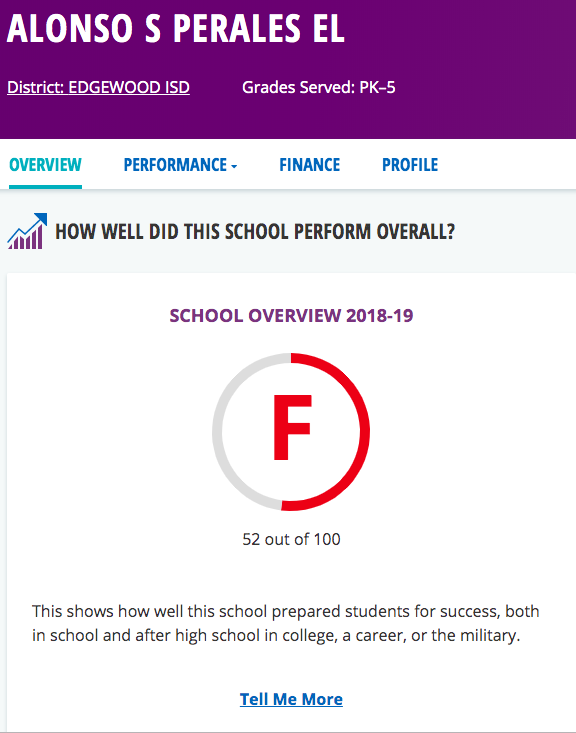
There have been some steps in that direction. Under the Every Student Succeeds Act, many states incorporated “growth scores” as a component of overall scores to demonstrate the value of what is happening inside the school. Each calculates and weights them a bit differently, but in general growth scores describe how much knowledge a student gains in one year, regardless of where they started. With wealthy students starting school already ahead of their lower-income peers, growth scores, in theory, should keep schools from being penalized for where their students started.
Parents care about more than tests as well. In the beginning, as No Child Left Behind took effect, the ratings were simple reflections of state assessment performance—something Great Schools no longer sees an adequate measures of school quality. Since 2007 Great Schools has continually expanded and honed the criteria that go into its ratings, including growth scores and other equity metrics.
“Our goal as an organization is to provide the broadest picture of school quality,” Great Schools CEO Jon Deane said. “We’re generally looking at, how can we tell a complete story?”
Stanford University professor Sean Reardon is one of the nations’ leading proponents of using growth measures over proficiency scores to determine school quality and measure the opportunities afforded to students. “If parents were to use the learning rate data to help inform their decisions about where to live, they might make very different choices in many cases,” he said in a news article on the Stanford website.
A Brown University study by David Houston and Jeffery Henig seems to back that claim. In an experimental situation when parents were asked to select a school using demographic information and growth scores, they chose less white and wealthy districts than when they were given demographic information with achievement scores.
However, a new report and data tool from Reardon’s team showed that segregated schools with concentrated poverty do not move students forward academically as well as socioeconomically diverse schools and wealthier schools. Their growth scores would be lower. The report would not say definitively what accounted for the difference in growth, but did suggest some possibilities including limited resources and teacher experience.
So prioritizing growth scores might make a parent choose a different school…but probably not highly segregated, low-income school. Changing the way ratings are calculated hasn’t make disparities disappear, because disparities still exist in schools. The fundamental truth learned from No Child Left Behind still stands: not all kids are getting the same quality of education. We know more about the gaps—they show up in almost any measure we invent—but we haven’t been as successful in addressing them.
Families know this, but for many, the neighborhoods around the most highly rated schools are out of their price range. “A large percentage of our users are low-income parents,” Deane said.
For them, finding the right school is an art. They need the more complex data available on GreatSchools.org to figure out if their children can thrive in more middling-rated schools–those in the yellow 4-7 range. Then, they can go back to Zillow, and find an affordable home to match.
Did you want a good school, or a white school? Or are those the same thing?
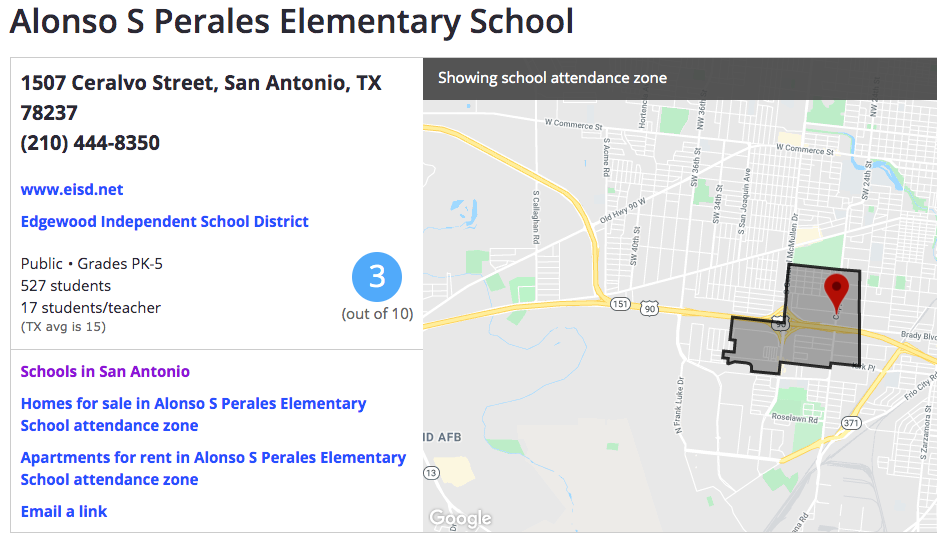
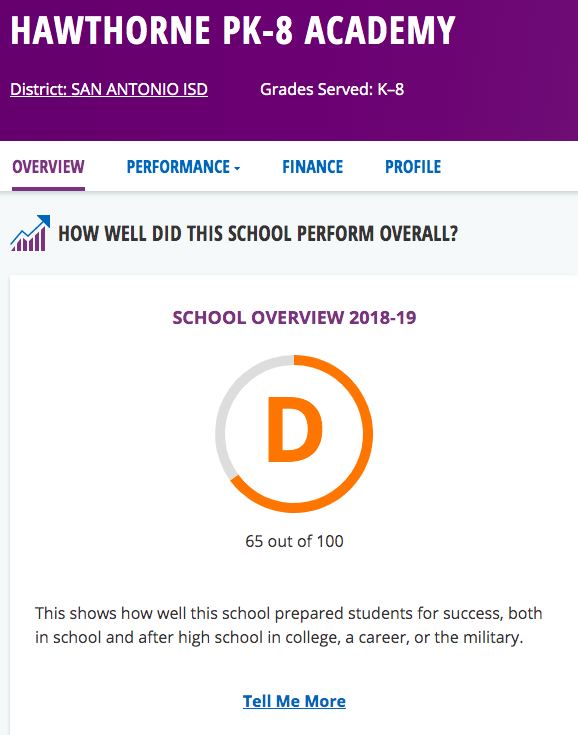
While deeper exploration is possible on the Great Schools site itself, the real estate websites only show the summary score. Seeing the summary dark orange “2” instead of a green “9” can have an immediate effect on a family wanting to purchase or rent a house close to the best possible school. As long as ratings act as market drivers for certain neighborhoods, they will increase segregation, which will increase the disparities reflected in the ratings, said Schneider.
“Good schools” sell houses. Alleviating inequality does not, Schneider explained, “The market doesn’t create integration.”
However, it’s not clear whether the ratings themselves are actually changing homebuyer habits, as much as reinforcing them, and making the process more efficient. While both state agencies and Great Schools continue to make more information available to parents, that data still generally tracks with income and racial demographics. Ratings are, whether the shopper intends them to be or not, a shortcut to finding schools with more affluent, whiter students.
Some researchers and most integration advocates acknowledge that parents may explicitly prefer whiter schools. What bothers Florida mom Stephanie Ilderton is it that this desire can be laundered of its racism by the seemingly simple science of ratings. Meanwhile, families who are looking for diversity may think they are getting a more racially and economically agnostic measure, but they aren’t, she explained, “The ratings are really incredibly biased.”
When Ilderton looked around her son’s Orlando metro-area school, she saw a lot of things she liked: strong academics, engaged teachers, and classrooms with books and materials for every child. What she didn’t see were black adults. As white parents with adopted black sons, Ilderton said, she and her husband needed to find “racial mirrors” for their children.
“We’re always on the hunt for role models for our sons,” she said.
She knew that finding a new school meant moving, so she consulted Zillow. From there, she quickly realized that the school ratings were leading her away from where she wanted to be. It was easy to find schools rated 9 and 10 in suburban Orlando near the university where her husband is a professor. But if she limited herself to 9s and 10s, she said, it ruled out the most diverse schools and the neighborhoods they served.
It bothered her that the ratings confirmed what people in her area already associated with “good schools,” she explained— whiter, wealthier students—thus rewarding decades of racial and economic segregation. “I don’t even think it’s intentional,” she said.
Ilderton is also acutely aware that disparities can continue within a highly-rated school. She needed more than a simple rating to know if her sons would be well-served academically and socially.
To find the supplemental information she wanted, Ilderton combed the Office of Civil Rights Database, visited schools, and eventually settled on a school that was rated lower than their current school, but still an 8 on the Great Schools rating system. It received a “B” on the Florida state report card, lower than the district as a whole, but the academic performance for black students was proportional to their representation in the student body—information she gleaned from Great Schools and the state report card. Both allow users to explore performance for different groups of students. Upon visiting the school, Ilderton was pleased to see black teachers around.
She knew which school she wanted, and only then did Ilderton returned to Zillow. She used a tool on the website that allows users to search for homes within the attendance zone of their desired school.
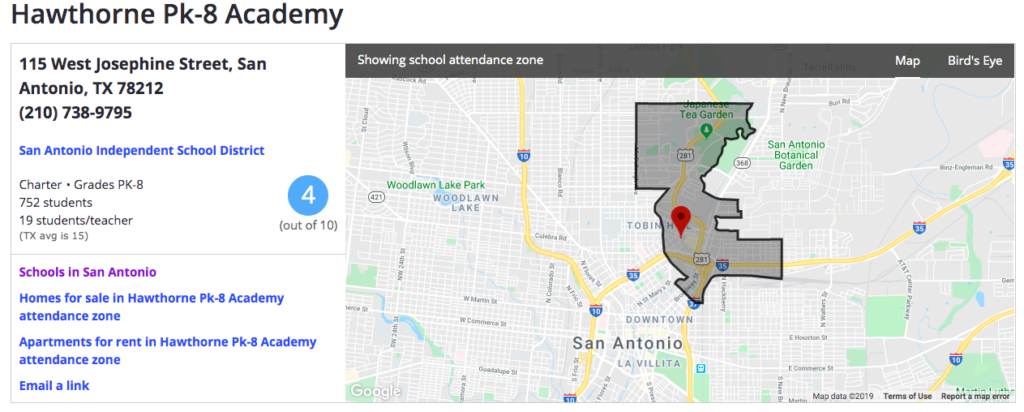
A map is focused on a geographical area: a city, a zip code, a suburb. Alongside the map, area schools are listed next to their ratings. Location.
Users click on the school name, and a map shows up, highlighting the attendance zone. Location.
The user then clicks “houses for sale inside this attendance zone” and another map shows up, empty except for qualifying homes. Location.
The tool does not tell parents what they should be looking for in a school. It leaves the moral quandry of balancing quality and equity to the individual parent. Ilderton used the tool to find a more diverse school, but it chilled her how easy it could have been used to continue the racial and economic sorting process that troubles her so much. It was, in a sense a metaphor for how people already thought about certain areas. As Schneider put it, “All they have to do is click a button and all these neighborhoods go away.”